> ## Documentation Index
> Fetch the complete documentation index at: https://docs.jitra.app/llms.txt
> Use this file to discover all available pages before exploring further.
# Viewing Eco Driving Overview
> Learn how to filter and interpret fleet safety score, risk, behavior trends, and penalties in Eco Driving Overview.
Eco Driving Overview summarizes the selected Profile and period at fleet level.
## Loading the Overview
1. Open Analytics > Eco Driving > Overview.
2. Select a Profile.
3. Select the required date range.
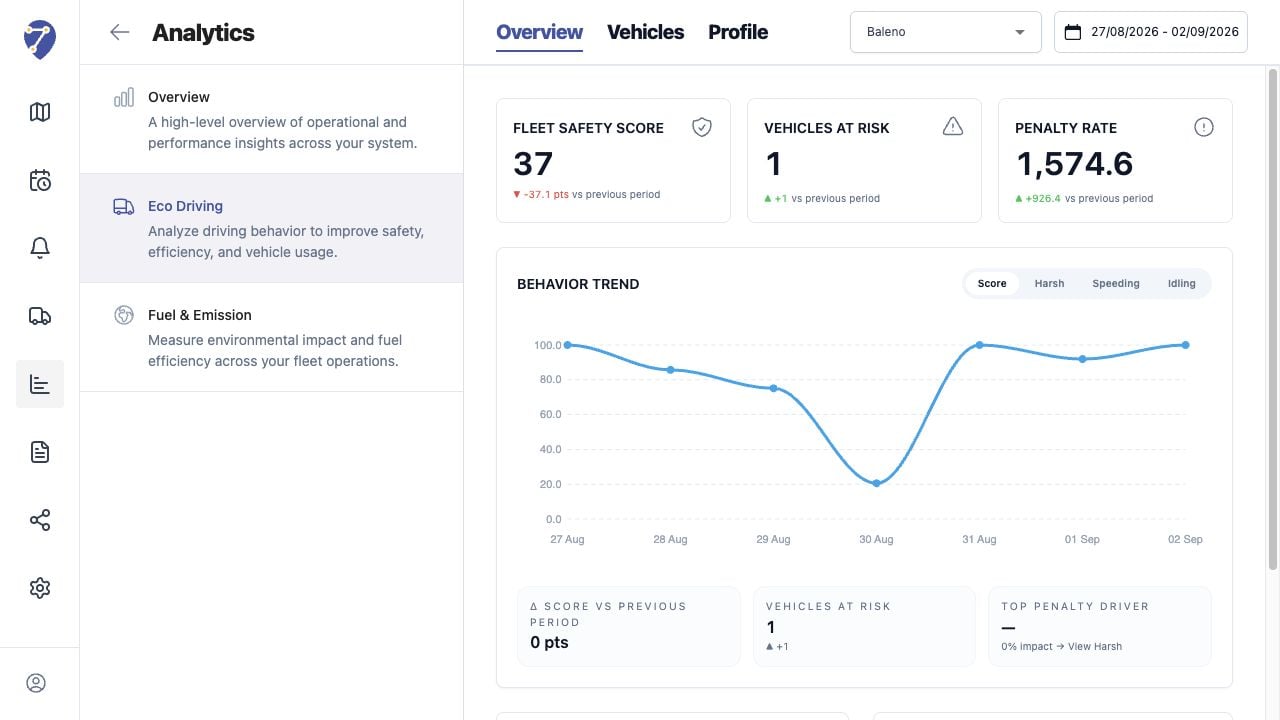 ## Reading the Main Metrics
* Fleet Safety Score
* Vehicles at risk
* Penalty Rate
* change versus the previous period
## Reading Behavior Trend
Switch between Score, Harsh, Speeding, and Idling. The chart and diagnostic values follow the selected behavior.
## Reviewing Risk and Penalties
Highest Risk Vehicles ranks Objects by score and Events. Penalty Contribution shows which behavior contributes most to the result.
## Comparing Periods
Keep the same Profile and comparable date lengths when evaluating change. Profile edits or assignment changes can make two periods unsuitable for direct comparison.
## Reading the Main Metrics
* Fleet Safety Score
* Vehicles at risk
* Penalty Rate
* change versus the previous period
## Reading Behavior Trend
Switch between Score, Harsh, Speeding, and Idling. The chart and diagnostic values follow the selected behavior.
## Reviewing Risk and Penalties
Highest Risk Vehicles ranks Objects by score and Events. Penalty Contribution shows which behavior contributes most to the result.
## Comparing Periods
Keep the same Profile and comparable date lengths when evaluating change. Profile edits or assignment changes can make two periods unsuitable for direct comparison.