> ## Documentation Index
> Fetch the complete documentation index at: https://docs.jitra.app/llms.txt
> Use this file to discover all available pages before exploring further.
# Reviewing Fuel & Emission by Vehicle
> Review distance, fuel usage, economy, CO2, intensity, idle time, and idle fuel for each Object.
Vehicles shows calculated Fuel & Emission values for each assigned Object in the selected Profile and period.
## Loading Vehicle Results
1. Open Analytics > Fuel & Emission > Vehicles.
2. Select a Profile.
3. Select the date range.
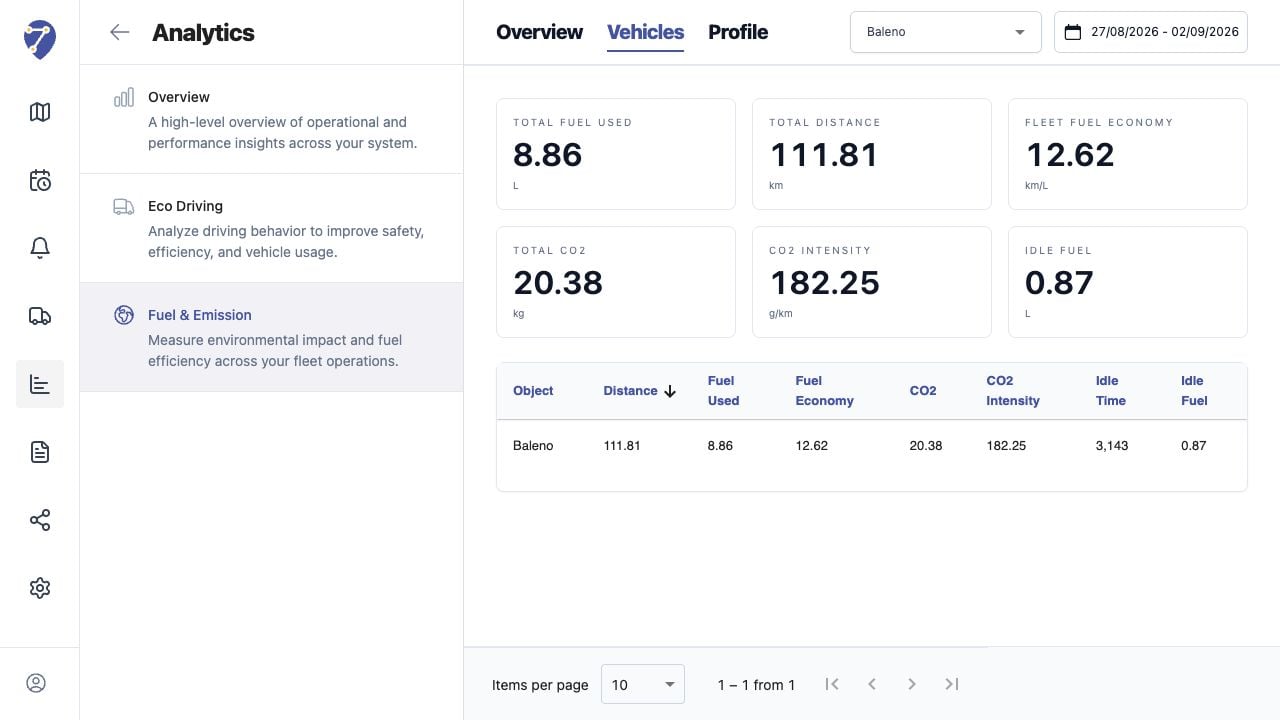 ## Reading Summary Metrics
* Total Fuel Used
* Total Distance
* Fleet Fuel Economy
* Total CO2
* CO2 Intensity
* Idle Fuel
## Reading the Table
Each Object row shows Distance, Fuel Used, Fuel Economy, CO2, CO2 Intensity, Idle Time, and Idle Fuel.
## Sorting and Paging
Click a column heading to compare Objects by the selected metric. Use Items per page and page controls for larger fleets.
## Investigating Differences
A high absolute fuel value may reflect longer distance, while high CO2 Intensity may indicate low economy or excessive idle time. Compare the row with History and the Profile settings.
## Using Calculated Data
Treat the table as an operational estimate. Record the Profile and period when using values in an external analysis so the assumptions remain traceable.
## Reading Summary Metrics
* Total Fuel Used
* Total Distance
* Fleet Fuel Economy
* Total CO2
* CO2 Intensity
* Idle Fuel
## Reading the Table
Each Object row shows Distance, Fuel Used, Fuel Economy, CO2, CO2 Intensity, Idle Time, and Idle Fuel.
## Sorting and Paging
Click a column heading to compare Objects by the selected metric. Use Items per page and page controls for larger fleets.
## Investigating Differences
A high absolute fuel value may reflect longer distance, while high CO2 Intensity may indicate low economy or excessive idle time. Compare the row with History and the Profile settings.
## Using Calculated Data
Treat the table as an operational estimate. Record the Profile and period when using values in an external analysis so the assumptions remain traceable.