> ## Documentation Index
> Fetch the complete documentation index at: https://docs.jitra.app/llms.txt
> Use this file to discover all available pages before exploring further.
# Viewing Analytics Overview
> Learn how to read fleet status, activity summaries, and Event signals from the Jitra Analytics Overview.
Analytics Overview summarizes live fleet condition and recent operational activity without requiring a Profile selection.
## Opening Overview
Open Analytics and select Overview.
 ## Reading Fleet Status Snapshot
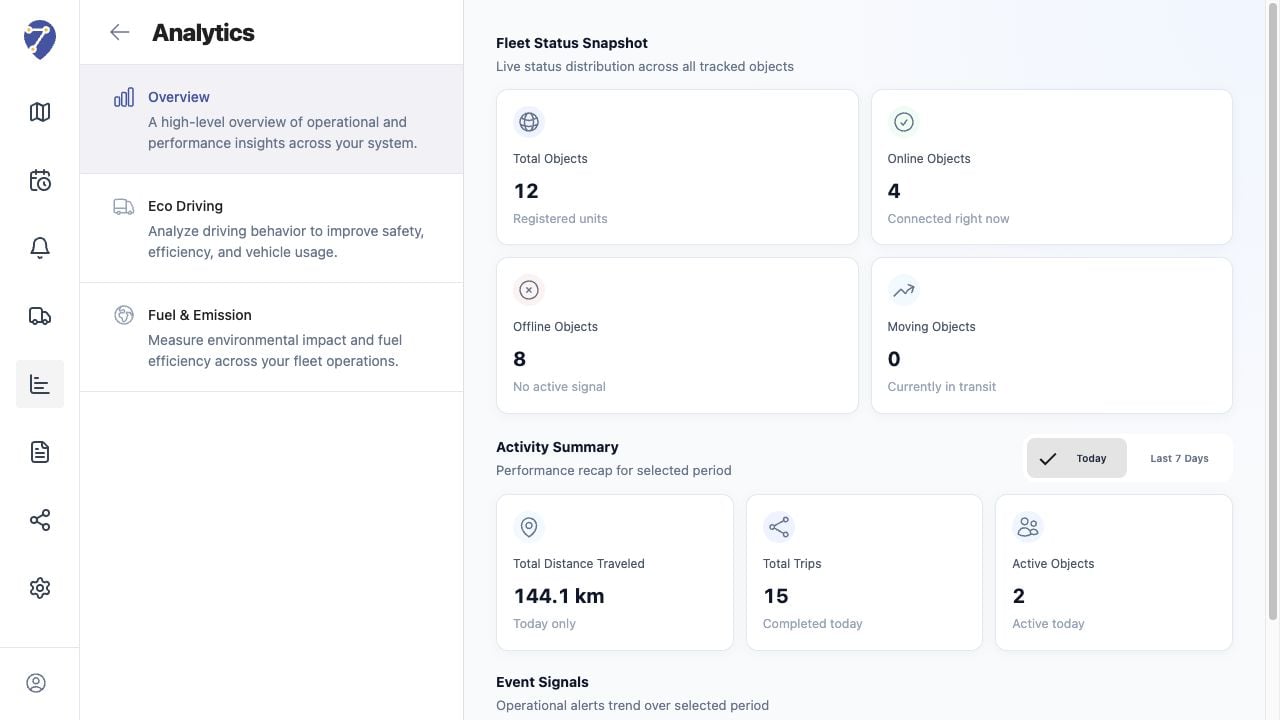
* Total Objects: registered tracking units
* Online Objects: Objects with an active connection
* Offline Objects: Objects without an active signal
* Moving Objects: Objects currently identified as moving
## Reading Activity Summary
Choose Today or Last 7 Days. The cards show Total Distance Traveled, Total Trips, and Active Objects for the selected period.
## Reading Event Signals
Event Signals visualizes Overspeed and Geofence In or Geofence Out activity. The chart and totals change with the selected period.
## Interpreting the Result
Use Overview as a starting point. A high Offline count should be checked in Tracking, while unexpected activity or Event totals should be investigated in History and Events & Notifications.
## Reading Fleet Status Snapshot
* Total Objects: registered tracking units
* Online Objects: Objects with an active connection
* Offline Objects: Objects without an active signal
* Moving Objects: Objects currently identified as moving
## Reading Activity Summary
Choose Today or Last 7 Days. The cards show Total Distance Traveled, Total Trips, and Active Objects for the selected period.
## Reading Event Signals
Event Signals visualizes Overspeed and Geofence In or Geofence Out activity. The chart and totals change with the selected period.
## Interpreting the Result
Use Overview as a starting point. A high Offline count should be checked in Tracking, while unexpected activity or Event totals should be investigated in History and Events & Notifications.